What it is
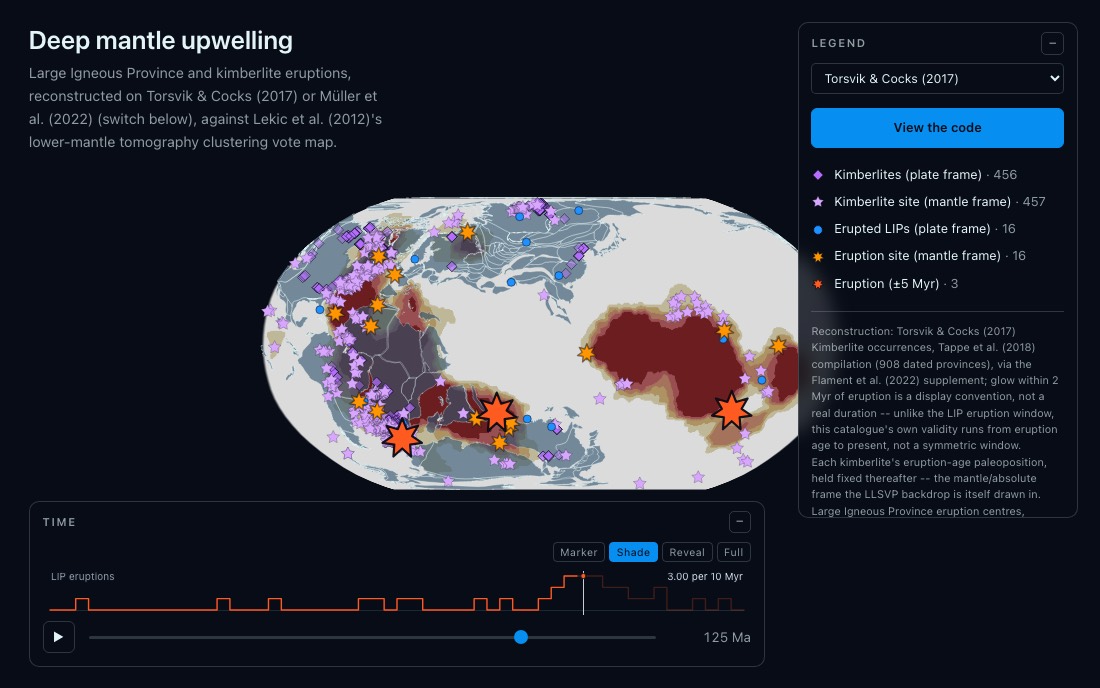
Large igneous provinces and kimberlites over the last 540 Myr, reconstructed on the plates that carried them, over a fixed backdrop: the two Large Low-Shear-Velocity Provinces in the lower mantle, from Lekic et al. (2012)'s tomography vote map.
Each eruption leaves two marks: one carried on its plate to where that crust is today, and one held at its eruption-age position, where it sat above the deep mantle. Switch between Torsvik & Cocks (2017) and Müller et al. (2022) and every layer, stars included, moves to that model's answer.
Contents
- LLSVPsLekic et al. (2012) lower-mantle vote map, never reconstructed.
- LIPsCEED6 compilation, Torsvik & Cocks (2016), 31 provinces.
- KimberlitesTappe et al. (2018), via Flament et al. (2022), 908 younger than 540 Ma.
- Mantle-frame starsEach eruption's paleoposition, fixed from then on.
- EruptionA large star for each LIP's ±5 Myr eruption window.
- ModelsTorsvik & Cocks 2017 and Müller et al. 2022, anchor plate 0.
- LIP frequencyEruptions per 10 Myr above the time slider.
Controls
- Age slider 0–540 Ma, or press play.
- Choose the reconstruction model from the legend.
- Click a legend row to show or hide that layer.
- Hover a marker for its name and age; drag to pan.
Lesson sketches
Do eruptions cluster at the LLSVP edges?
- Hide the plate-frame layers so only the mantle-frame stars show.
- Play from 540 Ma to the present and note where each LIP star lands relative to the red LLSVPs.
- Count stars inside, on the edge and well outside.
- Switch model and count again.
How much of the pattern survives a change of reconstruction model, and what would it take to call it significant?
Two frames, one eruption
- Pick a LIP, such as the Deccan Traps at about 65 Ma, and watch it erupt.
- Follow its blue dot to the present day.
- Compare where the dot ends up with where its star stays.
Why does a map of where LIPs are today say little about where the mantle plumes were?