What it is
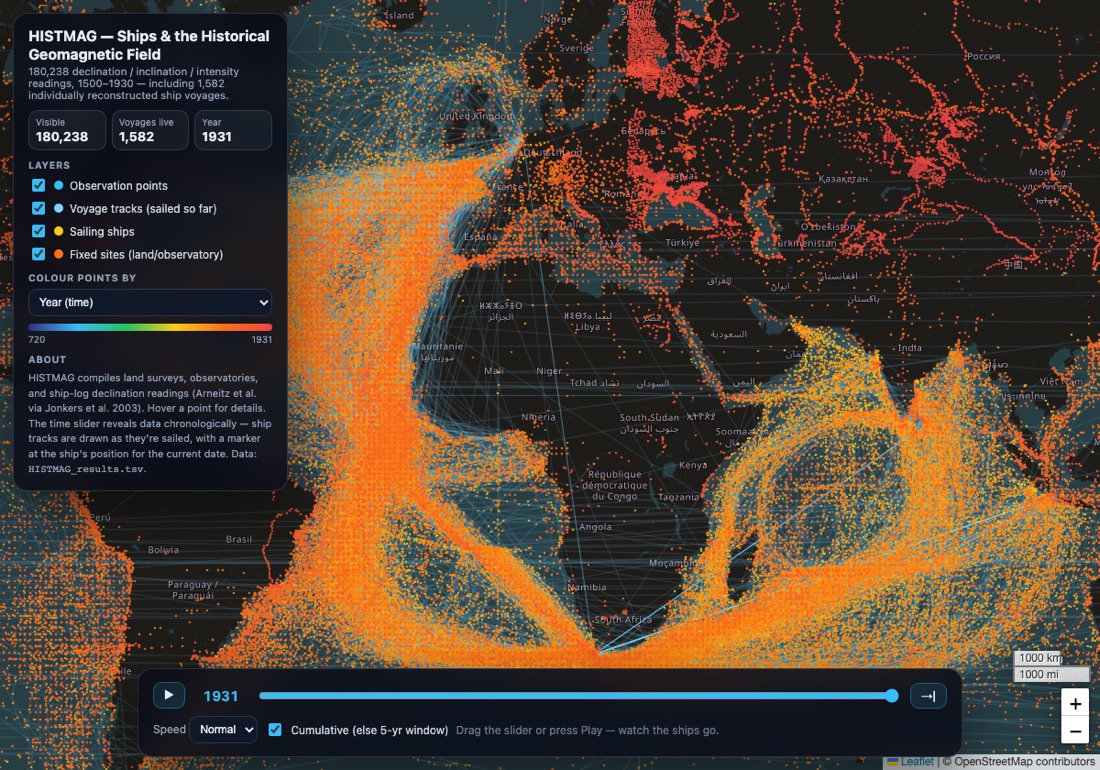
180,238 declination, inclination and intensity readings from HISTMAG, revealed chronologically. 1,582 are reconstructed ship voyages: each track draws as the ship sails it, with a marker at the vessel's position on that date.
Most of these readings were taken by navigators. Declination had to be known to steer by, so the record of the historical field is a by-product of four centuries of shipping, and the map is as much one of trade routes as of magnetism.
Contents
- Points180,238 readings, coloured by year or by value.
- Voyages1,582 tracks, drawn as they are sailed.
- ShipsA marker per vessel at the current date.
- Fixed sites~100,000 land surveys and observatory records.
- WindowEverything so far, or a five-year window.
Controls
- Drag to pan, scroll to zoom.
- Drag the year slider or press play.
- Toggle points, tracks, ships and fixed sites independently.
Lesson sketches
The shape of the trade winds
- Play through the eighteenth century, watching the Atlantic.
- Sketch the dominant route out to the Caribbean, and the route back.
- Explain why they differ, and why the outbound dips so far south.
- Find the same pattern in the Indian Ocean.
What does the empty middle of the South Pacific tell you?
The field from other people's logbooks
- Colour by measured value and step through the centuries.
- Say which parts of the world have dense coverage in 1700, and which have none.
- Consider what a spherical harmonic model does over an ocean nobody crossed.
Which parts of the historical field are measured, and which are extrapolated?
Why the compass lies
- Show a point and read its declination.
- A compass points at the magnetic pole, not the geographic one.
- Run the clock: the value at a fixed place keeps changing.
If the field drifts, how did anyone navigate before GPS?
Source
No public repository yet.