What it is
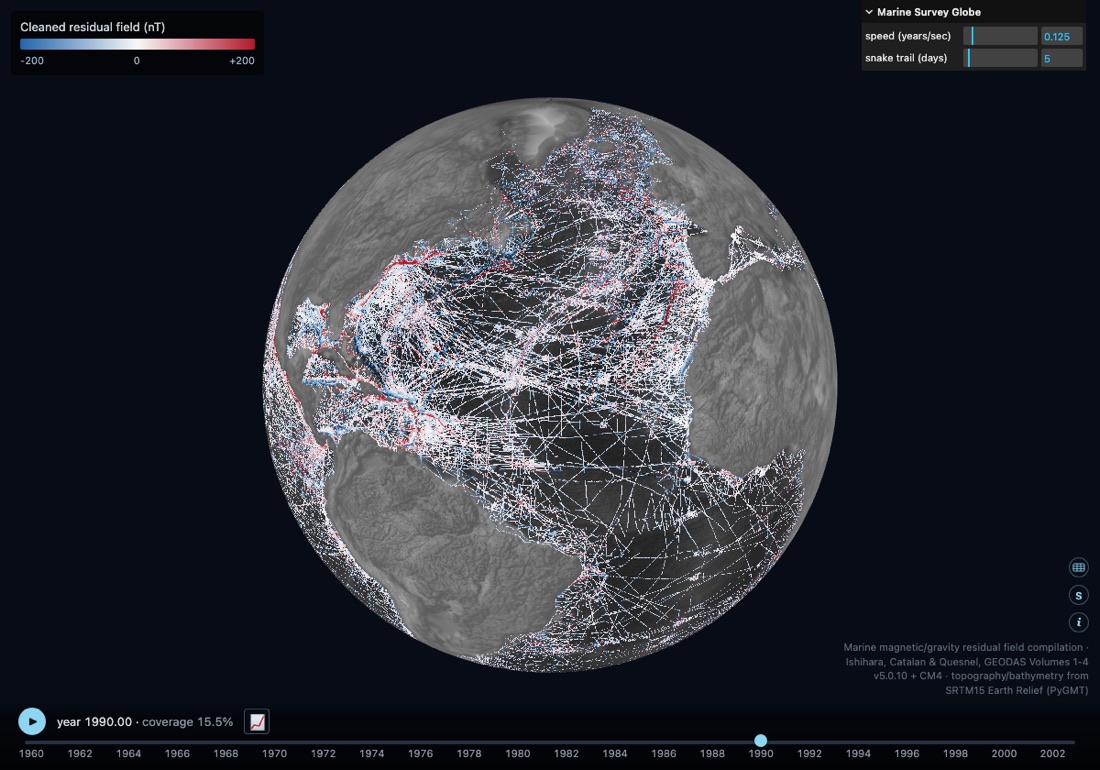
Marine magnetic and gravity coverage accumulating from 1960 to 2002 over a relief backdrop. Every track is a real cruise, coloured by the residual field it measured, with a running percentage of seafloor surveyed.
Coverage is not a survey design. It is an accumulation of cruises funded for their own reasons, and the gaps are where nobody had a reason to go.
Contents
- Tracks~20 million measurements, GEODAS volumes 1–4.
- ColourCleaned residual field in nT, blue to red about zero.
- CruisesHover for ship, institution and, where known, chief scientist.
- ChartsCumulative coverage, annual track-km against oil price, north/south asymmetry.
- AntarcticADMAP2 values and an AntMagic age grid, in EPSG:3031.
- ProjectionsGlobe or Plate Carrée.
Controls
- Drag to rotate, scroll to zoom.
- Press play or drag the timebar.
- Chart icon opens the context charts; S switches to the Antarctic layer.
Lesson sketches
Where the data is not
- Run to 2002. Identify the three largest unsurveyed areas.
- For each, propose a reason: remoteness, ice, weather, politics, or nobody asking.
- Check the north/south chart against where the funding agencies were.
Every global grid interpolates across these holes. What does that do to a number read off one?
Survey effort follows the money
- Open the charts. Describe the shape of annual survey effort.
- Overlay the oil price and mark where the two move together.
- Find a year where they do not, and look up why.
What kind of science gets done in a downturn?
Stripes on the seafloor
- Zoom to a well-surveyed stretch of the Mid-Atlantic Ridge.
- Show the colour flipping along a track that crosses it.
- Each flip is the field reversing, frozen into cooling rock.
The field has flipped hundreds of times. Would we notice the next one?