What it is
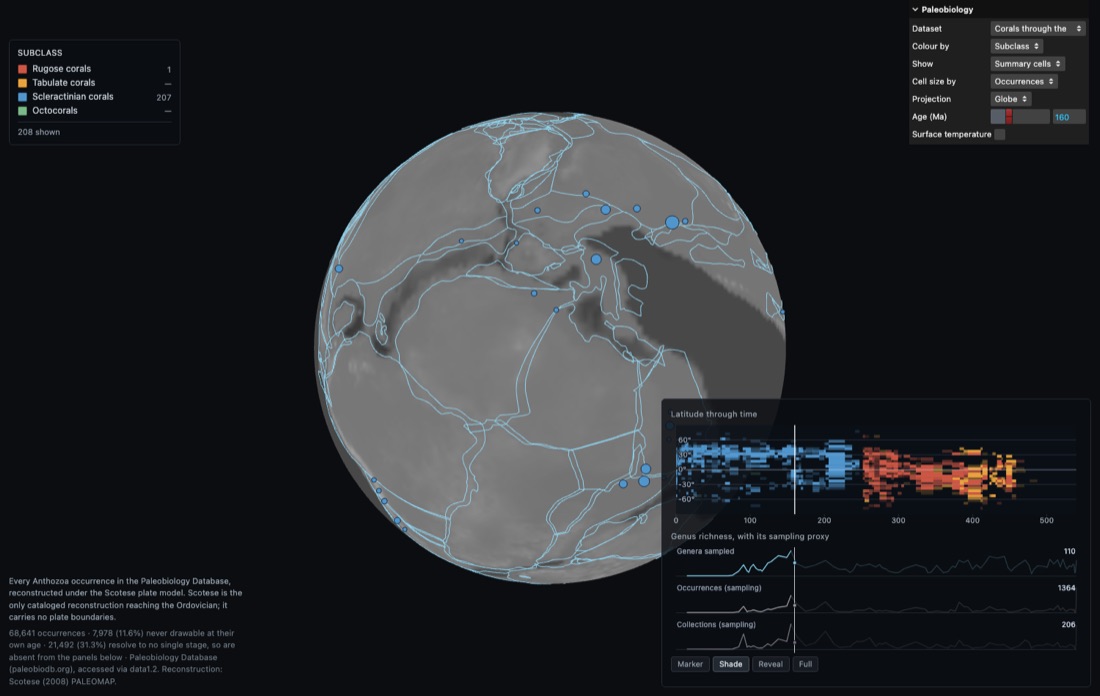
Paleobiology Database occurrences reconstructed to the crust they came from and binned into equal-area cells. The diversity curve is raw genus counts drawn beside occurrence and collection counts, so the sampling confound sits next to the signal.
Contents
- GlyphsOne per occupied equal-area cell, pie by group or sized by richness.
- OccurrencesThe individual collection points behind each glyph.
- CoralsLatitude, richness and turnover across four mass extinctions.
- InterchangeA case where the plate geometry is the mechanism.
- DiversityRichness plotted against occurrence and collection counts.
Controls
- Drag to rotate, scroll to zoom.
- Time slider through the Phanerozoic.
- Toggle aggregate glyphs against raw occurrences.
Lesson sketches
Crash, or gap in the rock record?
- Find a sharp drop in coral richness. Note the age.
- Check whether occurrence and collection counts drop with it, and by how much.
- Classify it: signal, sampling, or undecidable here.
- Find a second drop that classifies differently.
What evidence would settle the ones you marked undecidable?
Corals track the tropics
- At 0 Ma, record the latitude band coral occurrences occupy.
- Step back in 50 Myr jumps, recording the band each time.
- Plot band against age and mark where it widens.
How would this plot look if the occurrences had never been reconstructed?
When a seaway closes
- Show the region before the connection forms: two separate faunas.
- Scrub through the closure.
- Show the same region after, mixed.
A barrier for a fish is a highway for a mammal. What else works that way?