What it is
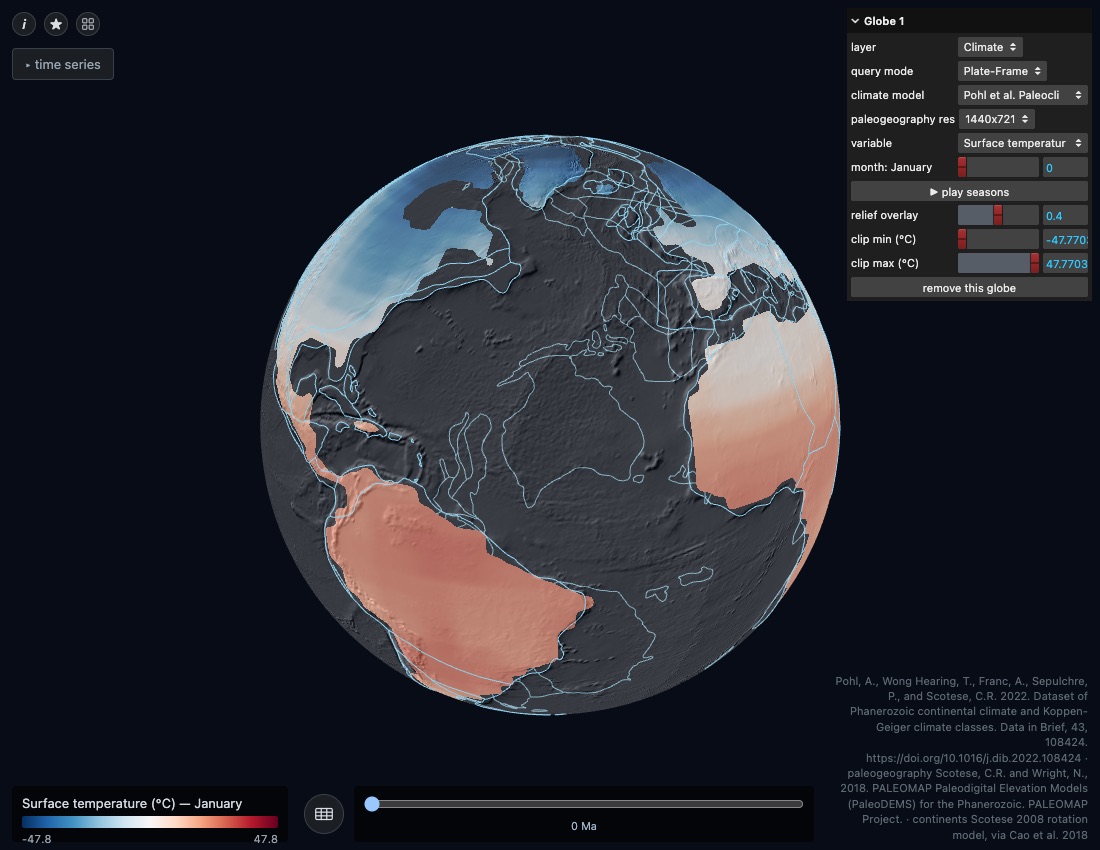
Two 540 Myr simulations at monthly resolution, draped on a globe whose continents move underneath. A Query Point reads one cell across all of time: Anchored holds a fixed latitude and longitude, Plate-Frame rides the moving crust.
Contents
- Two modelsLi et al. 2022 and Pohl et al. 2022, switchable.
- Monthly fieldsTemperature and precipitation, month by month.
- DerivedAnnual mean, seasonality, Köppen classes.
- WindGlyphs or animated streaks.
- PaleogeographyLand, shelf and deep ocean per slice.
- Query PointAnchored or Plate-Frame time series.
- Multi-globeTiled globes for direct comparison.
- ProjectionsGlobe, Robinson, Plate Carrée.
Controls
- Drag to rotate, scroll to zoom.
- Time slider for the reconstruction, month slider for the season.
- Place a Query Point, then pick Anchored or Plate-Frame.
Lesson sketches
Continentality, measured
- Show seasonality at 0 Ma. Describe the pattern in one sentence.
- Go to 250 Ma, Pangaea assembled. Describe it again.
- Query Points at the centre and the edge of the supercontinent; compare annual ranges.
Where on that map would you rather farm?
The rock's climate, not the place's
- Anchored Query Point on a present-day coal basin. Plot temperature through time.
- Switch the same point to Plate-Frame. Plot again.
- Find where the curves diverge and check what the crust was doing then.
Which curve would you compare against a proxy record from the outcrop?
Two models, one question
- Tile two globes, same variable and time, one model each.
- Scrub the Phanerozoic and mark where they disagree most.
- Query the same point in both and quantify the gap.
What do the two models share that could make them agree for the wrong reason?