What it is
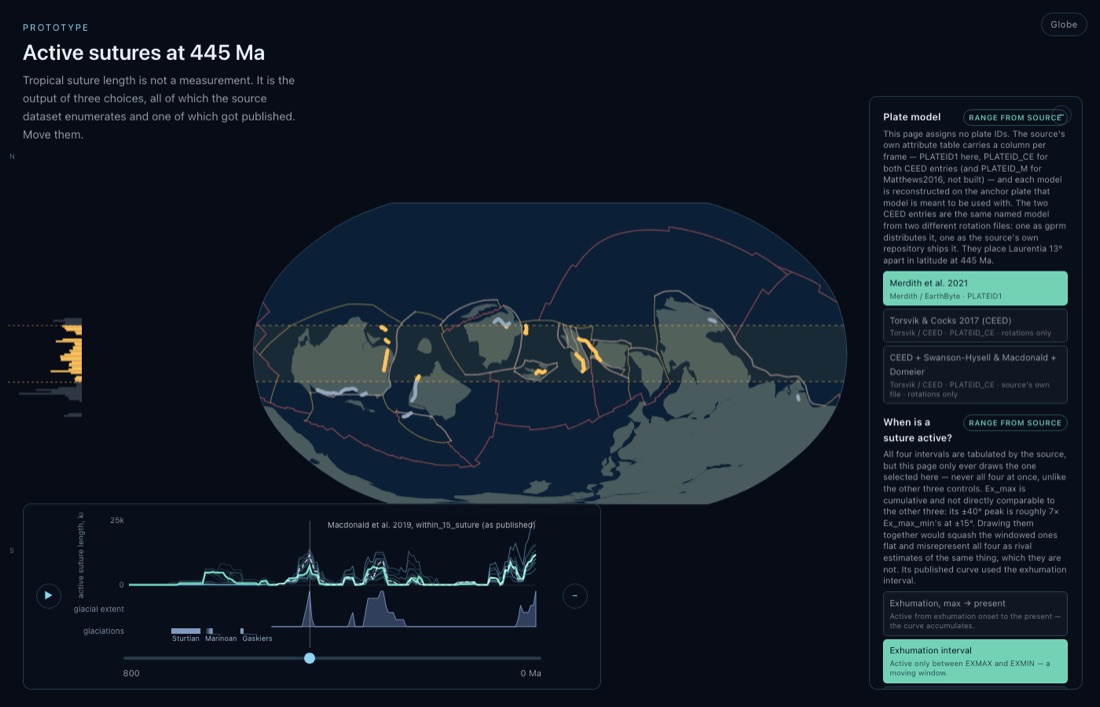
Active suture length in the tropics, 800 Ma to now, under every combination of plate model, activity definition, latitude band and band edge the source tabulates. The bright line is the setting you chose; the faint ones are the settings you did not.
Sensitivity, not uncertainty. No correlation coefficient anywhere, because two autocorrelated geological series will give you a high r and a meaningless p.
Contents
- Three modelsMerdith 2021, Torsvik & Cocks 2017 (CEED), CEED plus Swanson-Hysell, Macdonald and Domeier.
- The same model twiceTwo CEED entries from different rotation files. Laurentia 13° apart at 445 Ma.
- Four definitionsExhumation max-to-present, exhumation interval (published), magmatic, metamorphic. One at a time.
- Four bands±10°, ±15° (published), ±20°, ±40°.
- Band edgeHard, as everyone publishes it, or a cosine taper, which is this page's own.
- ReferenceMacdonald et al. 2019, with glacial extent beneath.
- What was lostSutures dropped and clamped per model, and what fraction reconstructs.
Controls
- Drag to pan, scroll to zoom. Globe / Map switches projection.
- Slider runs 800 Ma to 0 Ma.
- Click a value to highlight it. Only activity definition draws one at a time.
- Hover a line to name its combination, click to snap the controls to it.
Lesson sketches
How many curves fit under one published figure?
- Set the published combination: exhumation interval, ±15°, hard edge.
- Let the plate model vary. Describe how far the curve moves.
- Open the band, then the band edge.
- Name the choice the result is most sensitive to.
Is the spread across choices an uncertainty? What would make it one?
One model, two files, 13 degrees
- At 445 Ma, switch between the two CEED entries and watch Laurentia.
- Measure the latitude difference.
- Read "what the reconstruction lost" for each.
Does citing a model by name identify what you actually ran?
Mountains, weathering, thermostat
- Set out the chain: collision, mountains, tropical weathering, CO₂ drawdown.
- Find the intervals with most suture inside the tropical band.
- Check them against the glaciations on the chart.
Every link in that chain is plausible. Which is weakest?